xtperf
Extended Toolkit to benchmark for time, CPU, memory
This project is maintained by njase
Usage details
Let us assume that there is an application called MyApp which you want to benchmark in some particular scenario.
A typical use case for such a benchmarking would be:
- Pre-setup To ensure reliability of benchmark results, we need to do some steps manually. Refer to your respective HW guide or OS guide on how to disable them:
- Disable BIOS based performance boosting technologies
- CPU throttling/requency scaling techniques: e.g. Intel SpeedStep and AMD Cool’n’Quiet
- CPU thermal based performance boosting techniques: e.g. Intel TurboBoost and AMD TurboCore
- Disable HyperTheading on Intel CPUs
- Disable BIOS based performance boosting technologies
- Get xtperf Download xtperf and install it as:
$> python setup.py installthis will be installed as module name “perf”
- Update any needed dependencies like matplotlib, statistics,psutil
-
Create benchmarking test scenario Create a test.py (or any other name) and write small test code to trigger the “particular scenario” of MyApp.
For useful analysis, benchmarking should always be performed for a controlled scenario.
See test.py for a simple example, and ilastikbench for a real example of writing such a test.
This test program is used as application process to collect process specific benchmark results
- Run benchmarking
$> python ibench.py --traceextstats 1 --loops=1 --values=1 -p 5 -o output.jsonChange -p
to the number of times benchmarking should be performed, and -o as desired file name for output. The rest are recommended as such. For more details, type: $> python -m perf help - Analyze output or save for offline analysis
- Graphical analysis of a single output with both system(-s) and process(-n) stats:
$> python -m perf plot -sn <mybenchmark.json> - Graphical comparative analysis of two benchmark results with both system(-s) and process(-n) stats
$> python -m perf plot -sn <mybenchmark1.json> <mybenchmark.json> - See results directly on command line:
$> python -m perf stats -x <mybenchmark.json>
$> python -m perf dump -d <mybenchmark.json>
- Graphical analysis of a single output with both system(-s) and process(-n) stats:
Output
The xtperf results can be stored in an output file in json format.
The results can be offline analyzed on command line using steps mentioned in previous section. These provide:
- Stats = mean, max and min in the collected benchmark results
- Dump = all the benchmark data
The results are displayed for each worker process and every periodic iteration within each worker.
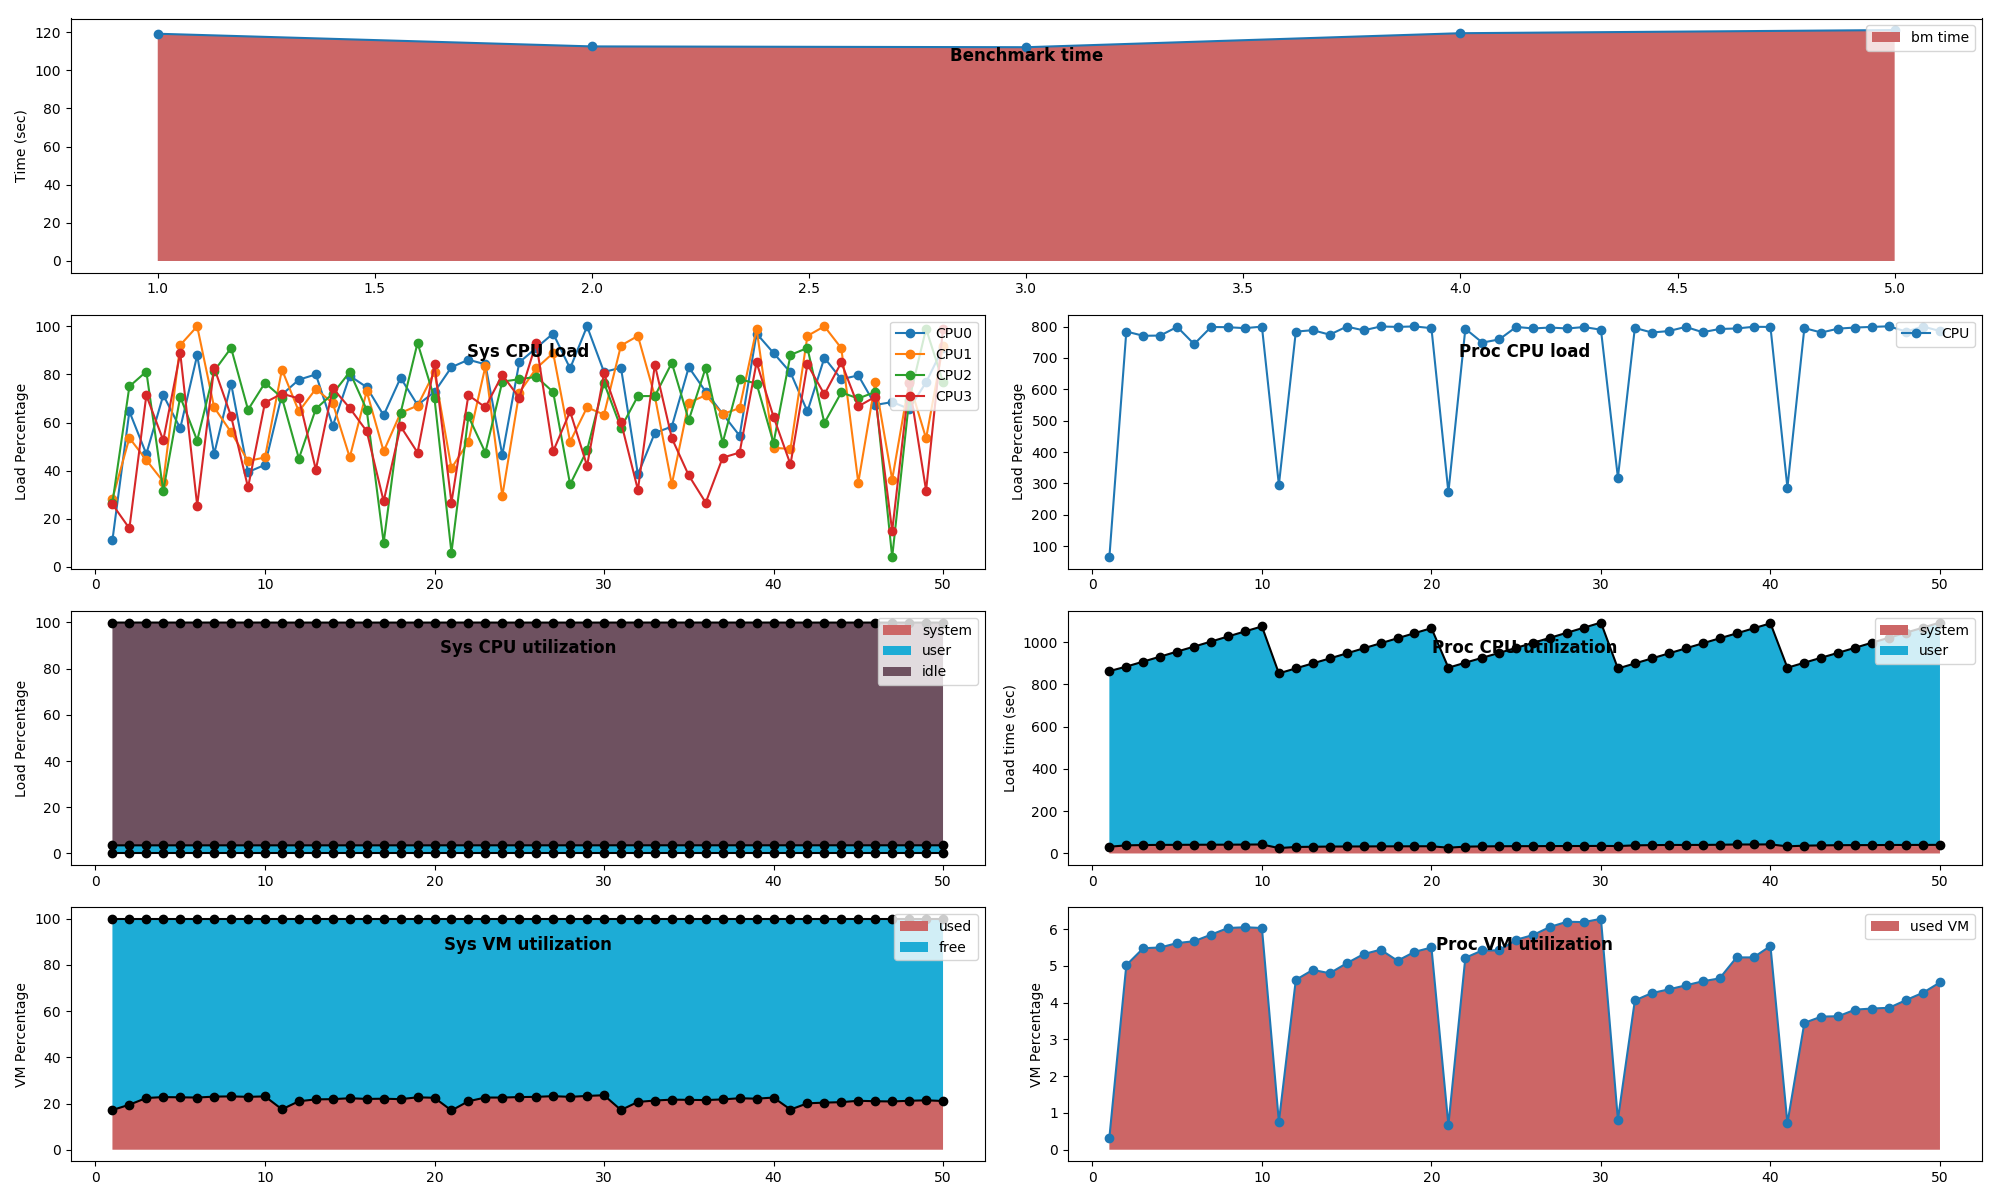
They can also be offline analyzed graphically using steps mentioned in previous section. Sample output is shown below.
These results show:
- Time benchmark on the top
- System wide benchmark on the left
- Process wide benchmark on the right

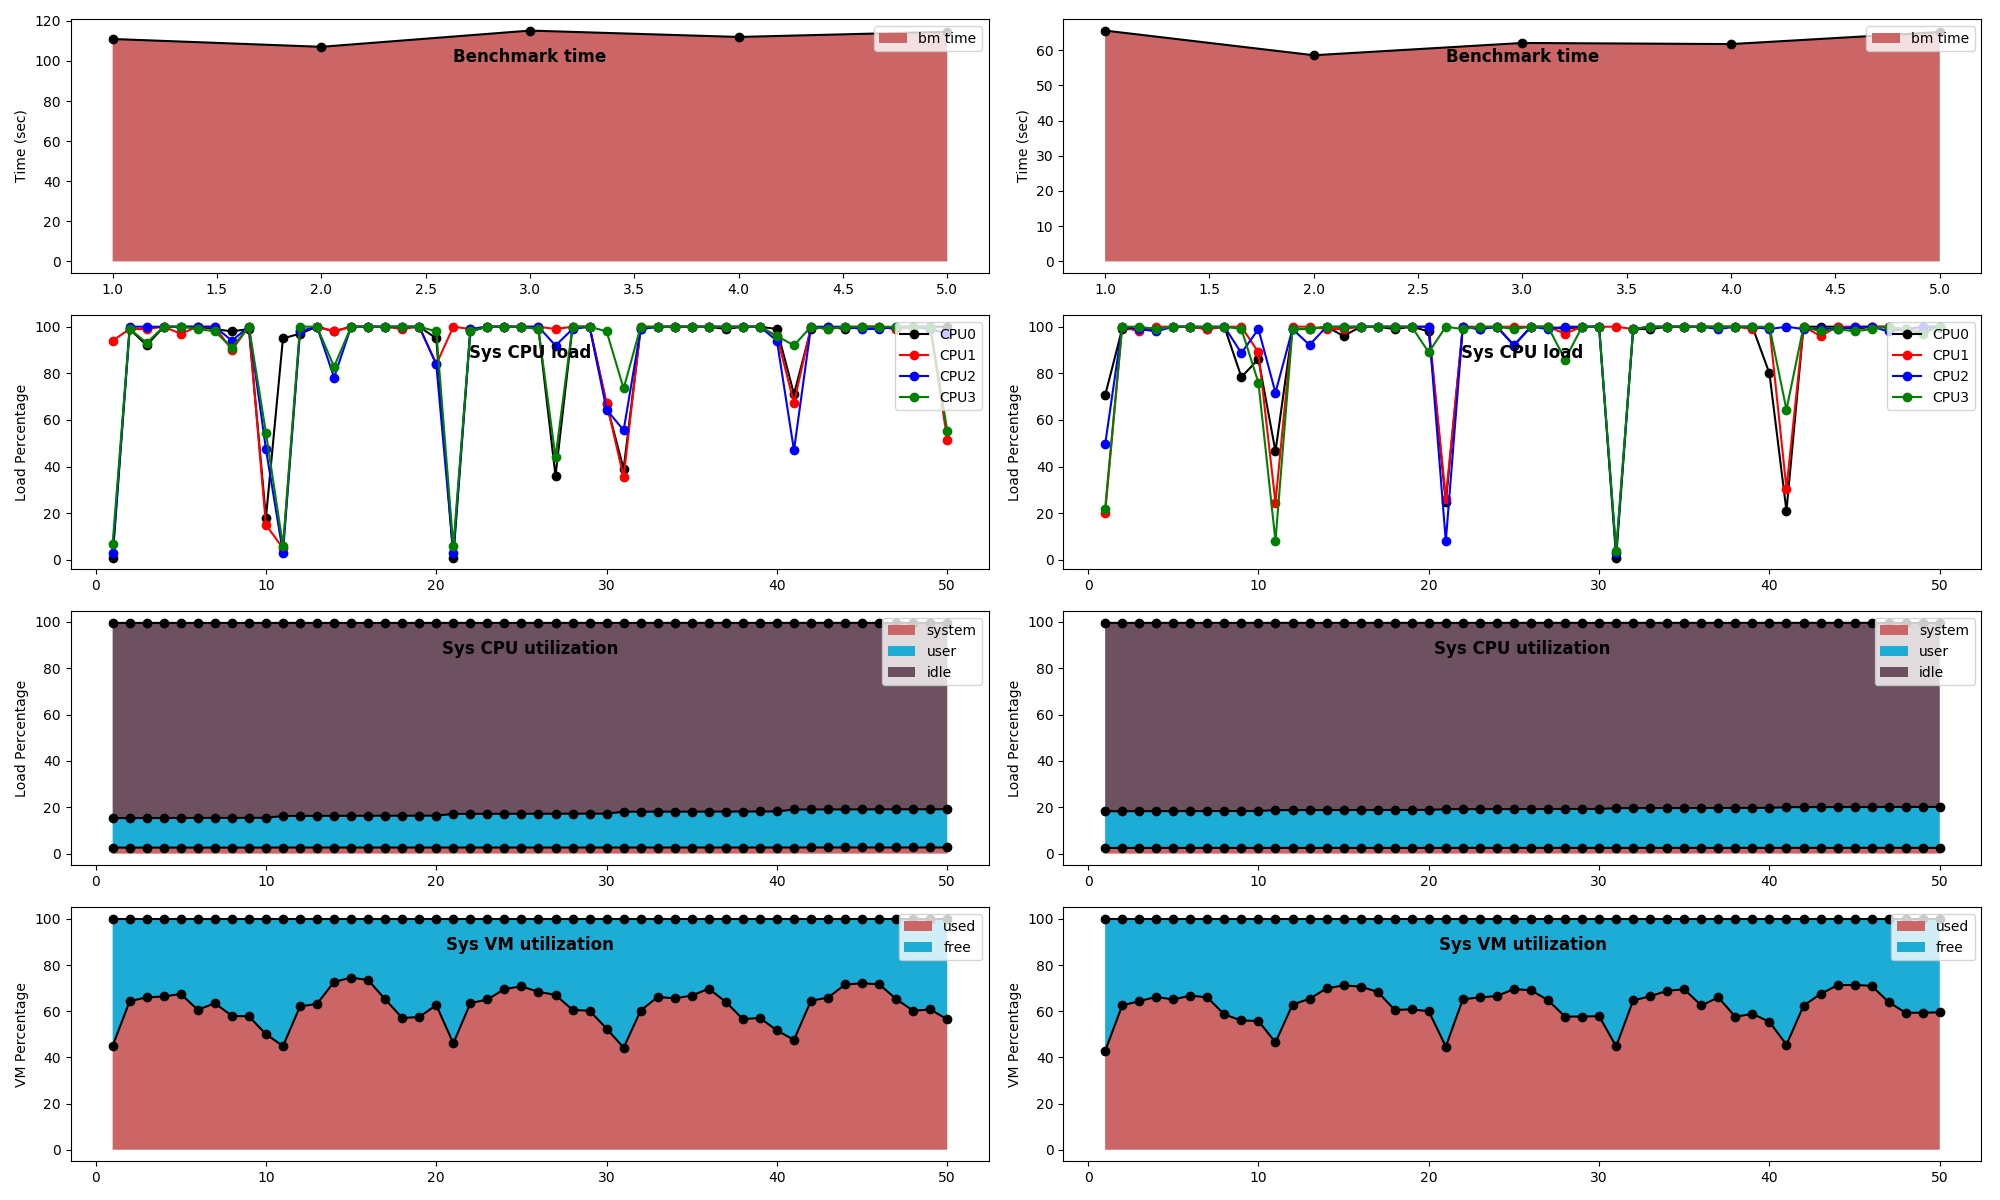
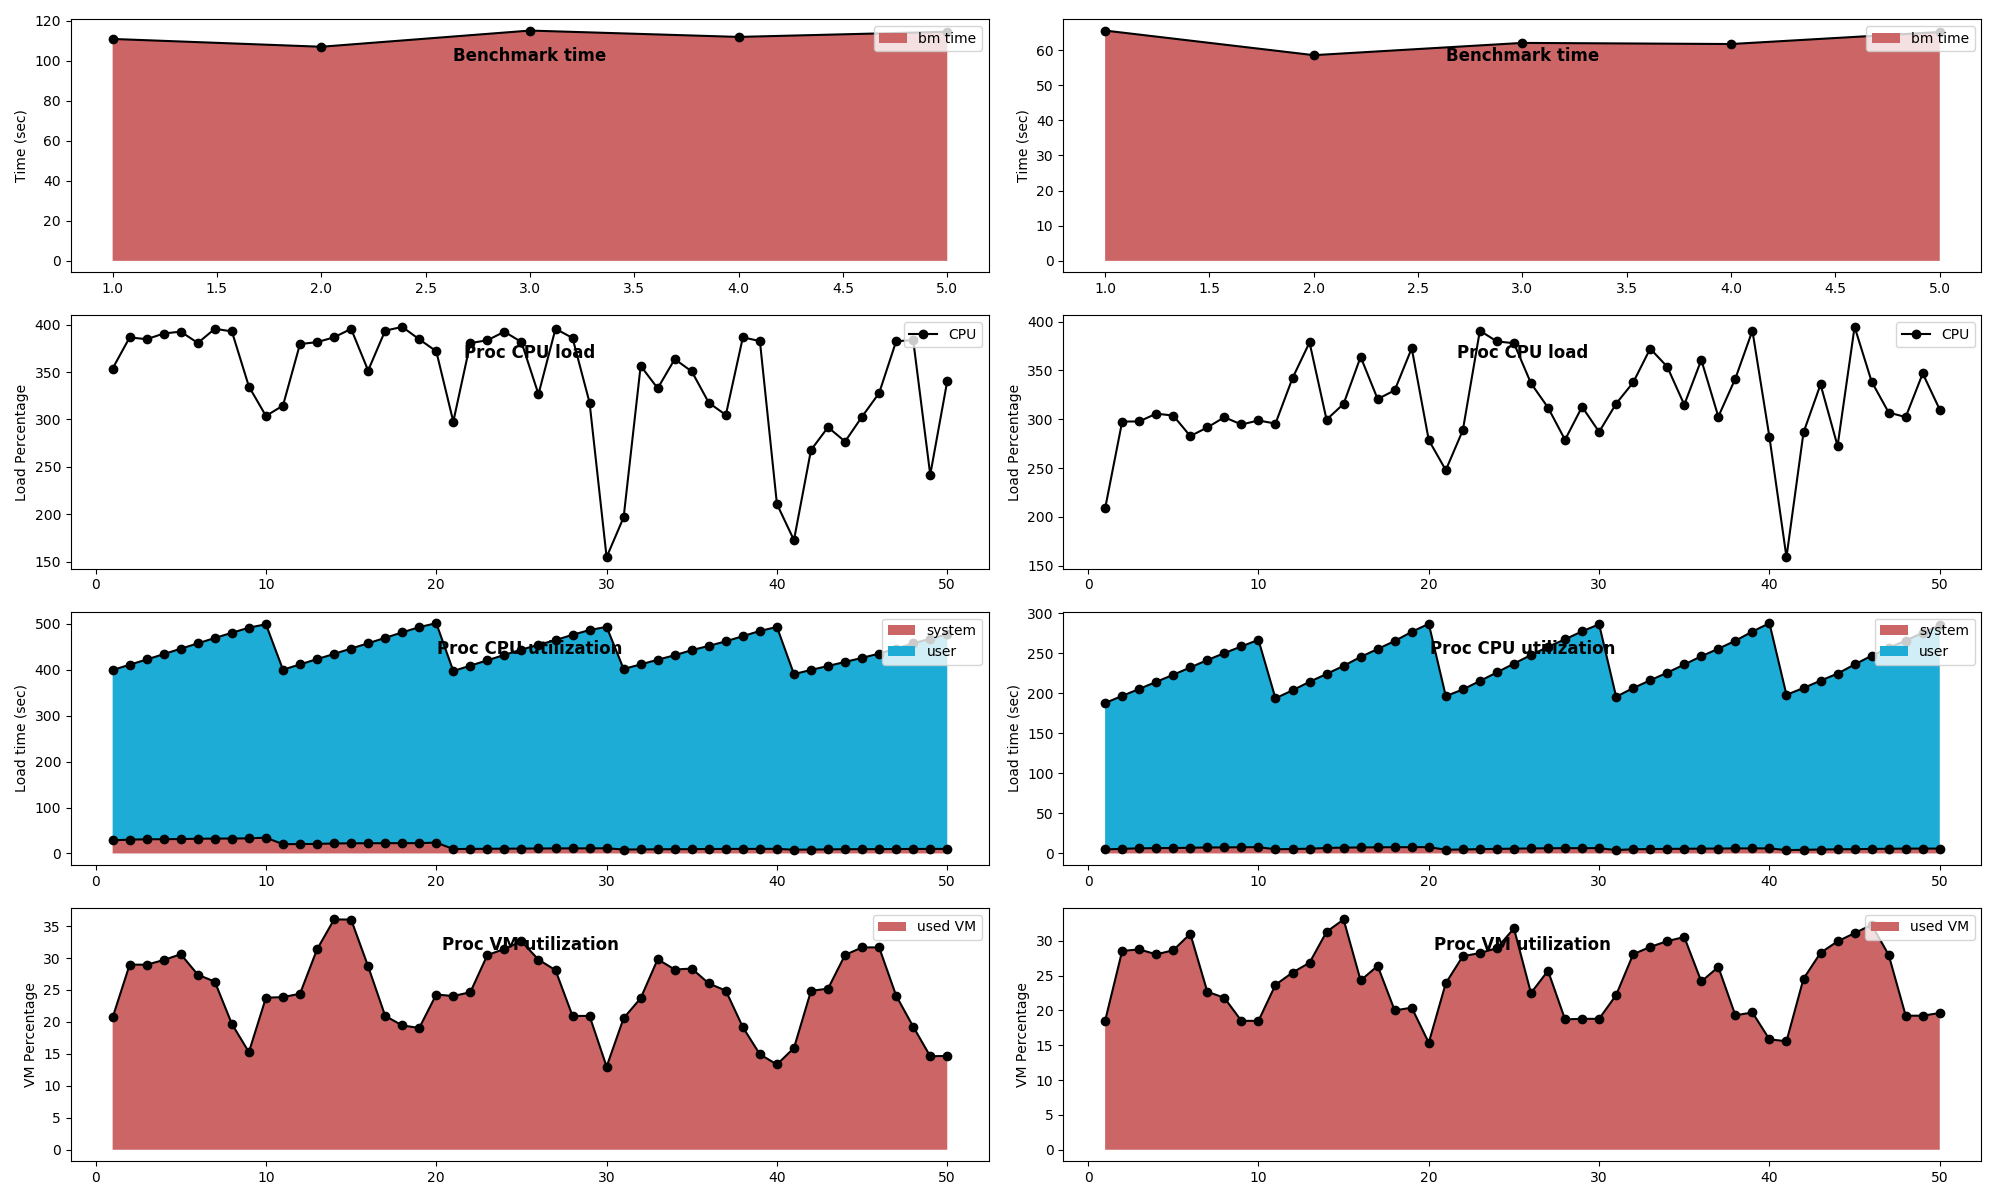
Other visualizations are possible, e.g. comparative plots across two benchmarks as shown below:


Remarks and recommendations
- For precision and accuracy reasons – run the experiment few times (3 times or more) to get reliable results
- For consistency of results, reboot the machine and repeat experiment
- Once steps 1,2,3 are performed on a machine, the regular benchmarking can be automated by writing scripts
- xtperf is based on perf toolkit. Therefore, all the commands which are provided by perf are supported by default. See perf help for more details